
The Landscape of State and Local Government Debt: What Small Businesses Need to Know
As a small business owner, especially if you’re currently contracted with or interested in partnering with the U.S. government, understanding the state and local government debt landscape is essential for navigating potential opportunities in government contracting. Recently, the Reason Foundation reported that state and local governments held an astounding $6.1 trillion in debt at the end of 2023. This staggering number translates to about $18,400 per American, vastly impacting the public services and infrastructure on which businesses rely.

Understanding Government Debt
This $6.1 trillion debt is divided among various entities: $2.66 trillion is owed by state governments, $1.4 trillion by municipalities, $1.27 trillion by school districts, and $757 billion by counties.
Understanding which U.S. states carry the most and least debt is more than just financial trivia. For federal and state government contractors, this data helps identify high‑spending regions, fast‑growing procurement markets, and areas with rising demand for cost‑saving products and services.
Using the latest numbers from Reason Foundation’s Government Finance Report, we’ve created a clear picture of where opportunities are growing. We also matched each state with federal spending and contract award activity using USA Spending’s state profiles.
This combination gives vendors a real‑time snapshot of where money is flowing and where agencies are most likely to buy.
Top 5 Most‑in‑Debt States (2025) & What Contractors Should Know
These states hold the highest total debt, driven by large populations, aging infrastructure, and heavy pension obligations. But high debt often goes hand‑in‑hand with higher contract spending, which translates to opportunity.
1. California — $496.81B in State Debt
Why Debt Is High:
Large population, significant pension obligations, and massive infrastructure spending.
Federal Contract Awards: ~$109B (one of the highest).
Where Contractors Can Win:
- IT modernization
- Green energy and emissions‑related projects
- Transportation, engineering, and public works
- Education and public health programs
2. New York — $233.27B in State Debt
Why Debt Is High:
High‑cost public programs, major transit systems, and big pension loads.
Federal Contract Awards: ~$62B.
Opportunity Areas:
- Urban transit and infrastructure
- Hospital and Medicaid‑aligned services
- Cybersecurity and digital services
- Emergency preparedness
3. Illinois — $222.82B in State Debt
Why Debt Is High:
Long‑term pension problems and structural budget issues.
Federal Contract Awards: ~$32B.
Opportunity Areas:
- Cost‑saving tech solutions
- Public safety & law enforcement equipment
- Education supplies
- Transportation materials
4. Texas — $216.93B in State Debt
Why Debt Is High:
Explosive population growth, highway expansion, and energy infrastructure.
Federal Contract Awards: ~$69B.
Opportunity Areas:
- Construction & civil engineering
- Energy and grid modernization
- School and municipal materials
- Disaster‑response and resiliency products
5. New Jersey — $213.35B in State Debt
Why Debt Is High:
High pension and benefit costs plus expensive public programs.
Federal Contract Awards: ~$23.5B.
Opportunity Areas:
- Transportation (ports, rail, roads)
- IT and cybersecurity upgrades
- Education and healthcare support services
Bottom 5 Least‑in‑Debt States (2025) & What Contractors Should Know
These states carry the lowest debt loads. While they spend less overall, their procurement cycles are steady, predictable, and often underserved which makes them excellent targets for niche vendors.
1. South Dakota — $2.46B in State Debt
Why Debt Is Low:
Small population, lean budgeting, and limited statewide programs.
Federal Contract Awards: ~$2.9B.
Opportunities:
- Rural infrastructure supplies
- Agriculture support services
- Emergency services equipment
2. Idaho — $4.83B in State Debt
Why Debt Is Low:
Conservative spending and lower program costs.
Federal Contract Awards: ~$5.5B.
Opportunities:
- Outdoor & land‑management equipment
- Construction materials
- IT modernization for growing cities
3. Nebraska — $4.91B in State Debt
Why Debt Is Low:
Stable budgeting, lower public program costs.
Federal Contract Awards: ~$6.8B.
Opportunities:
- Education & transportation supplies
- Ag‑related products
- Water and utilities infrastructure
4. Montana — $5.85B in State Debt
Why Debt Is Low:
Rural population and limited large‑scale programs.
Federal Contract Awards: ~$3.4B.
Opportunities:
- Forestry services
- Road and bridge materials
- Emergency response equipment
5. New Hampshire — $6.02B in State Debt
Why Debt Is Low:
Disciplined state spending and fewer statewide programs.
Federal Contract Awards: ~$3.7B.
Opportunities:
- School and municipal upgrades
- IT and cybersecurity
- Public safety supplies
High‑Debt vs. Low‑Debt States: What It Means for Contractors
High‑Debt States = High Contract Volume
States like California, New York, Texas, Illinois, and New Jersey consistently appear in the top tier of federal and state contract spending. These states often face pressure to modernize aging systems, cut costs, and increase efficiency which opens the door for vendors offering:
- Technology solutions
- Infrastructure materials
- Medical & safety equipment
- Administrative support services
Low‑Debt States = Focused, Niche Opportunities
Lower‑debt states may not spend as heavily, but they invest steadily in:
- Rural development
- Transportation safety
- Land and environmental management
- Public school systems
These markets reward vendors that build long‑term relationships and understand local needs.
Final Takeaway: Where Should Vendors Focus in 2025–2026?
Best states for volume:
California, Texas, Florida, New York, and Pennsylvania are all with extremely high contract award totals.
Best states for underserved markets:
Montana, South Dakota, Idaho, Vermont, and Wyoming where competition is lower and needs remain steady. Data from low‑debt rankings shows consistently small but reliable contract activity.
So why should you care?
1. Contracting Opportunities: Government spending often relates directly to its debt obligations. For example, states may need to contract services to manage this debt or improve services, leading to opportunities for small businesses in sectors like construction, IT, and consulting.
2. Infrastructure Investments: High debt levels can mean that state and local governments are looking for creative solutions to deliver services efficiently. This can lead to infrastructure projects where your business may consult or supply services.
3. Economic Growth and Stability: The debt incurred by governments means that they will require managed budgets which can influence business. Whether successful or struggling, the ripple effect of government finances will touch your normal operations.
The Breakdown of Debt: What It Means for Small Businesses
Nearly 80% of this debt is long-term, which includes bonds, loans, and unfunded liabilities such as pensions and health care obligations. All of this indicates ongoing commitments that local governments will need to meet, influencing how they prioritize funding and services.
– Public Pension Obligations: Almost $1.5 trillion is tied up in public pension obligations which can directly affect government budgets. If municipalities struggle to meet these liabilities, they may cut back on services or contract work which can limit new opportunities for small businesses.
– Retiree Health Care Obligations: An additional $958 billion is earmarked for retiree health care, further indicating the extensive commitments local and state governments hold. In practical terms, we may see higher taxes or reduced available funds for contracting services.
Understanding these elements is crucial when crafting proposals to government agencies. Businesses positioned to show how their services can help streamline or reduce these costs may have a competitive edge.
Per Capita Debt: A Closer Look
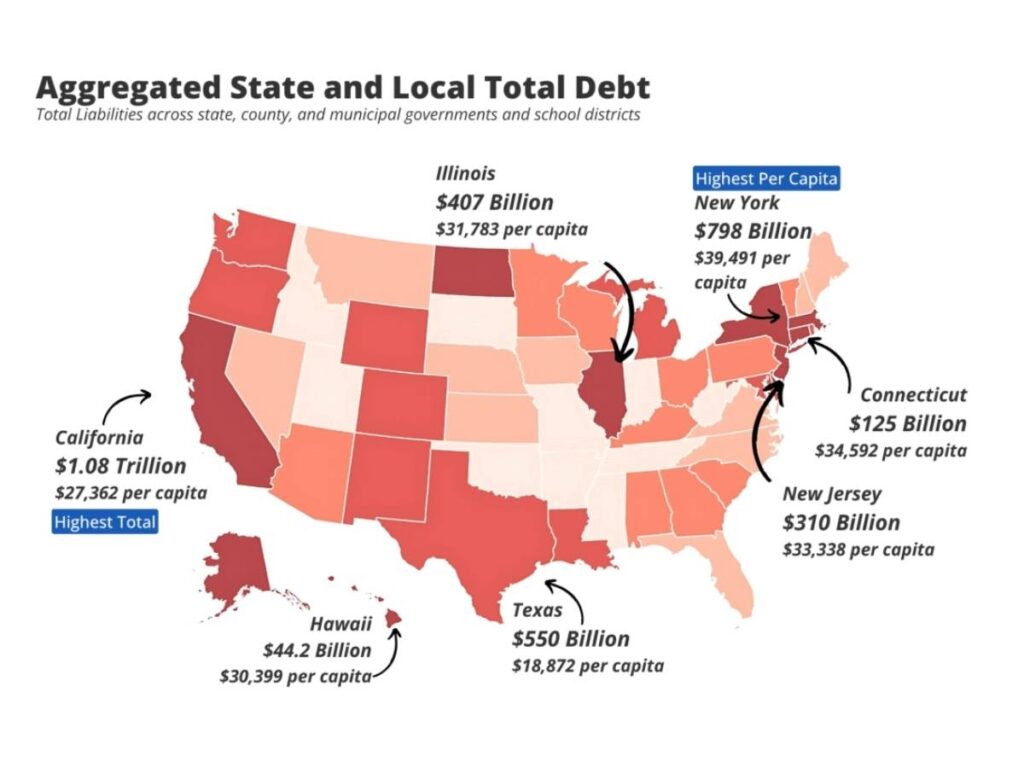
Diving deeper, states like New York hold a staggering $39,491 per resident in state and local debt, which is more than double the national average. This high debt might impact public investment priorities, meaning certain sectors might see cuts while others, like education or public safety, may gain funding.
For instance, if you are a service provider in education or technology aimed at improving infrastructure within school systems, you may find that demand increases despite the overarching debt levels.
How to Leverage Government Structure as a Small Business
1. Understand State Budget Cycles: Each state has its own budget cycle, which dictates when contracts may become available. Knowing when state budgets are planned can help you time your bids accordingly.
2. Aim for Business Certifications: If you are a veteran, woman, or a minority-owned business, ensure that you are certified in programs like VOSB (Veteran Owned Small Business), WOSB (Women-Owned Small Business), and HUBZone. These designations can help level the playing field when bidding on government contracts.
3. Consider the Impact of Debt on Local Economy: Staying informed about fiscal health can help you understand potential risks and opportunities in your area. A heavy local debt load may delay or cancel projects that could impact your service capabilities.
4. Engage with Local Agencies: Many states have offices dedicated to helping small businesses connect with government contracts. Reach out and form partnerships with these agencies to better position your business.
Conclusion
Navigating the intricate web of state and local government finances as a small business can seem daunting, but understanding the implications of this debt can put you ahead in identifying contracting opportunities. At Select GCR, we work to arm you with insights and resources that help you make sense of the government contracting landscape.
We invite you to connect with us for personalized support in navigating these opportunities, whether you’re looking to understand state budgets better, become certified as a minority-owned business, or simply seeking ways to align your services with governmental needs.
Sources
– Reason Foundation. (2023). State and Local Government Finance Report.
– USA Spending. National debt statistics.
